Cross-posted on Patrick Meier’s iRevolution blog
We’ve just completed our very first trial run of the Standby Task Volunteer Force (SBTF) Satellite Team. As mentioned in this blog post last week, the UN approached us a couple weeks ago to explore whether basic satellite imagery analysis for Somalia could be crowdsourced using a distributed mechanical turk approach. I had actually floated the idea in this blog post during the floods in Pakistan a year earlier. In any case, a colleague at Digital Globe (DG) read my post on Somalia and said: “Lets do it.”
So I reached out to Luke Barrington at Tomnod to set up distributed micro-tasking platform for Somalia. To learn more about Tomond’s neat technology, see this previous blog post. Within just a few days we had high resolution satellite imagery from DG and a dedicated crowdsourcing platform for imagery analysis, courtesy of Tomnod . All that was missing were some willing and able “mapsters” from the SBTF to tag the location of shelters in this imagery. So I sent out an email to the group and some 50 mapsters signed up within 48 hours. We ran our pilot from September 26th to September 30th. The idea here was to see what would go wrong (and right!) and thus learn as much as we could before doing this for real in the coming weeks.
It is worth emphasizing that the purpose of this trial run (and entire exercise) is not to replicate the kind of advanced and highly-skilled satellite imagery analysis that professionals already carry out. This is not just about Somalia over the next few weeks and months. This is about Libya, Syria, Yemen, Afghanistan, Iraq, Pakistan, North Korea, Zimbabwe, Burma, etc. Professional satellite imagery experts who have plenty of time to volunteer their skills are far and few between. Meanwhile, a staggering amount of new satellite imagery is produced every day; millions of square kilometers’ worth according to one knowledgeable colleague.
This is a big data problem that needs mass human intervention until the software can catch up. Moreover, crowdsourcing has proven to be a workable solution in many other projects and sectors. The “crowd” can indeed scan vast volumes of satellite imagery data and tag features of interest. A number of these crowds-ourcing platforms also have built-in quality assurance mechanisms that take into account the reliability of the taggers and tags. Tomnod’s CrowdRank algorithm, for example, only validates imagery analysis if a certain number of users have tagged the same image in exactly the same way. In our case, only shelters that get tagged identically by three SBTF mapsters get their locations sent to experts for review. The point here is not to replace the experts but to take some of the easier (but time-consuming) tasks off their shoulders so they can focus on applying their skill set to the harder stuff vis-a-vis imagery interpretation and analysis.
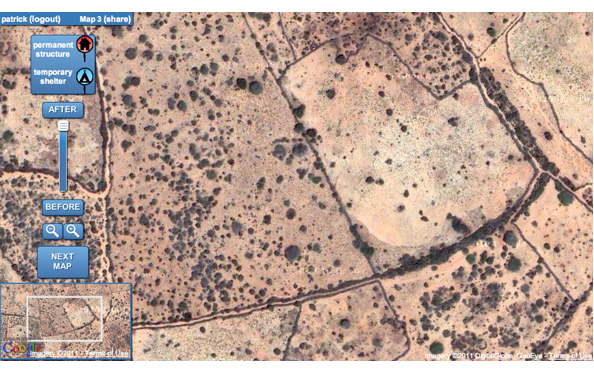
The purpose of this initial trial run was simply to give SBTF mapsters the chance to test drive the Tomnod platform and to provide feeback both on the technology and the work flows we put together. They were asked to tag a specific type of shelter in the imagery they received via the web-based Tomnod platform:
There’s much that we would do differently in the future but that was exactly the point of the trial run. We had hoped to receive a “crash course” in satellite imagery analysis from the Satellite Sentinel Project (SSP) team but our colleagues had hardly slept in days because of some very important analysis they were doing on the Sudan. So we did the best we could on our own. We do have several satellite imagery experts on the SBTF team though, so their input throughout the process was very helpful.
Our entire work flow along with comments and feedback on the trial run is available in this open and editable Google Doc. You’ll note the pages (and pages) of comments, questions and answers. This is gold and the entire point of the trial run. We definitely welcome additional feedback on our approach from anyone with experience in satellite imagery interpretation and analysis.
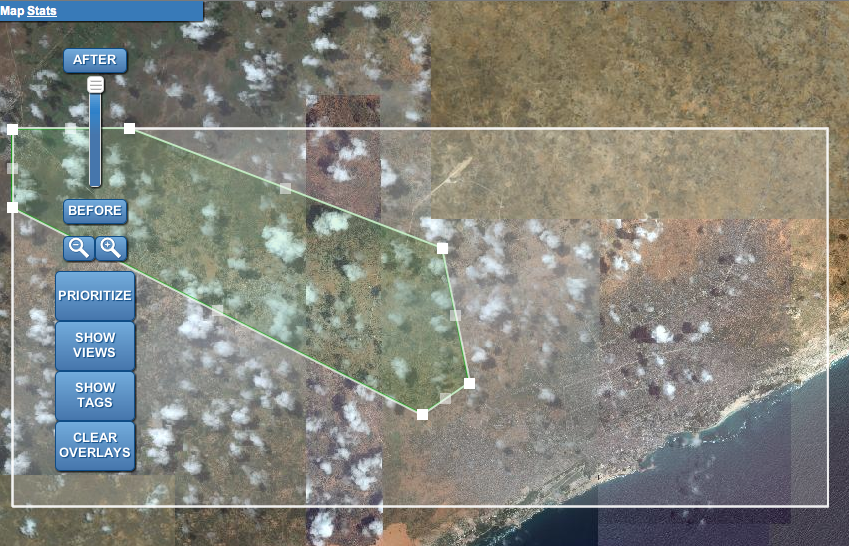
The result? SBTF mapsters analyzed a whopping 3,700+ individual images and tagged more than 9,400 shelters in the green-shaded area below. Known as the ”Afgooye corridor,” this area marks the road between Mogadishu and Afgooye which, due to displacement from war and famine in the past year, has become one of the largest urban areas in Somalia.
Last year, UNHCR used “satellite imaging both to estimate how many people are living there, and to give the corridor a concrete reality. The images of the camps have led the UN’s refugee agency to estimate that the number of people living in the Afgooye Corridor is a staggering 410,000. Previous estimates, in September had put the number at 366,000″ (1).
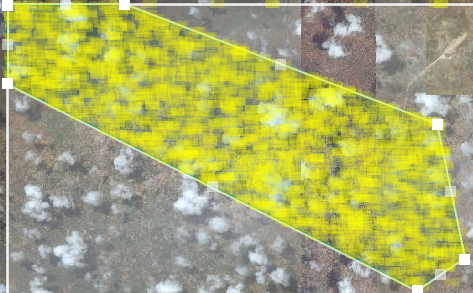
The yellow rectangles depict the 3,700+ individual images that SBTF volunteers individually analyzed for shelters: And here’s the output of 3 days’ worth of shelter tagging, 9,400+ tags:
Thanks to Tomnod’s CrowdRank algorithm, we were able to analyze consensus between mapsters and pull out the triangulated shelter locations. In total, we get 1,423 confirmed locations for the types of shelters described in our work flows. A first cursory glance at a handful (“random sample”) of these confirmed locations indicate they are spot on. As a next step, we could crowdsource (or SBTF-source, rather) the analysis of just these 1,423 images to tripple check consensus.
We’ve learned a lot during this trial run and Luke got really good feedback on how to improve their platform moving forward. The data collected should also help us provide targeted feedback to SBTF mapsters in the coming days so they can further refine their skills. On my end, I should have been a lot more specific and detailed on exactly what types of shelters qualified for tagging. As the Q&A section on the Google Doc shows, many mapsters weren’t exactly sure at first because my original guidelines were simply too vague. So moving forward, it’s clear that we’ll need a far more detailed “code book” with many more examples of the features to look for along with features that do not qualify. A colleague of mine suggested that we set up an interactive, online quiz that takes volunteers through a series of examples of what to tag and not to tag. Only when a volunteer answers all questions correctly do they move on to live tagging. I have no doubt whatsoever that this would significantly increase consensus in subsequent imagery analysis.
In related news, the Humanitarian Open Street Map Team (HOT) provided SBTF mapsters with an introductory course on the OSM platform this past weekend. The HOT team has been working hard since the response to Haiti to develop an OSM Tasking Server that would allow them to micro-task the tracing of satellite imagery. They demo’d the platform to me last week and I’m very excited about this new tool in the OSM ecosystem. As soon as the system is ready for prime time, I’ll get access to the backend again and will write up a blog post specifically on the Tasking Server.


2 Comments
Somalia from above looks very peace full.
One day whats happening on the ground will reflect that.
Great post, very informative.
So where the heck did this 6 and a half ton satellite land ?
3 Trackbacks
[...] analysis hinges on the verification process put in place. One possible technique is to triangulate crowdsourced tagging of satellite imagery with crowdsourced reporting from the ground. Hiring field monitors to verify information is another [...]
[...] UNHCR asked the standbytaskforce.com to crowdsource the location of shelters in the Afgooye corridor in Somalia, where a large number of people were displaced during the drought in. Tagging [...]
[...] asked the standbytaskforce.com (SBTF) to crowdsource the location of shelters in the Afgooye corridor in Somalia, where a large number of people were displaced during the drought in. Tagging [...]